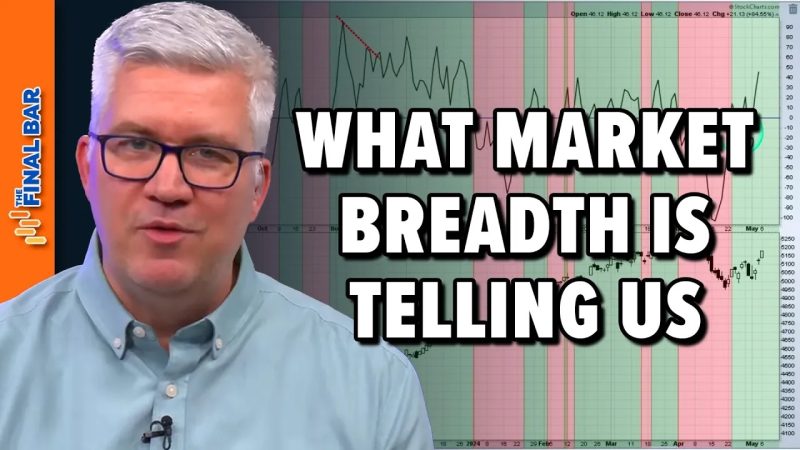
In the world of financial markets, investors and traders are constantly seeking indicators and tools to help them make informed decisions and gain an edge in their trading strategies. One often overlooked indicator that can provide valuable insights into market trends and potential reversals is the market breadth indicator. While many traders primarily focus on price movements of individual securities or market indices, the market breadth indicator offers a different perspective by measuring the strength and breadth of market participation.
Market breadth refers to the number of individual securities that are participating in a particular market move. It provides a measure of the underlying strength or weakness of a market trend by analyzing the number of advancing versus declining stocks. A market with positive breadth indicates that a broad range of stocks are participating in an uptrend, suggesting a healthy and sustainable move. Conversely, a market with negative breadth indicates that only a few stocks are driving the move, potentially signaling a weak and unsustainable trend.
One popular market breadth indicator that analysts and traders use is the Advance-Decline Line (AD Line). The AD Line is calculated by taking the difference between the number of advancing stocks and declining stocks on a given trading day and adding it to the cumulative total from the previous day. By plotting this cumulative total over time, traders can observe the overall health of a market by noting whether the AD Line is confirming the price trend or diverging from it.
Another commonly used market breadth indicator is the Arms Index, also known as the TRIN (Short-Term Trading Index). The Arms Index is calculated by dividing the ratio of advancing stocks to declining stocks by the ratio of advancing volume to declining volume. A reading above 1 indicates bearish sentiment, while a reading below 1 indicates bullish sentiment. Traders use the Arms Index to gauge market sentiment and identify potential turning points in the market.
Market breadth indicators should be used in conjunction with other technical analysis tools and indicators to confirm signals and validate trading decisions. While market breadth indicators can provide valuable insights into market trends and potential reversals, they should not be used in isolation as the sole basis for making trading decisions. Like any indicator, market breadth indicators have their limitations and can generate false signals in volatile or choppy markets.
In conclusion, keeping an eye on market breadth indicators can help traders gain a better understanding of overall market sentiment and strength. By analyzing the participation of individual stocks in a market move, traders can identify underlying trends and potential reversals before they become apparent in price movements. Incorporating market breadth analysis into your trading toolkit can provide a valuable edge in navigating the dynamic and ever-changing financial markets.


