


Technical Indicator Showdown: MACD vs. PPO vs. PMO
Moving Average Convergence Divergence (MACD), Percentage Price Oscillator (PPO), and Price Momentum Oscillator (PMO) are widely used technical indicators in financial analysis. Traders and investors often rely on these tools to gauge market trends and make informed decisions. Each of these indicators offers unique insights into price momentum and can be valuable additions to any trading strategy. Let’s take a closer look at the characteristics and applications of MACD, PPO, and PMO to understand their strengths and weaknesses.
MACD is a versatile indicator that combines several moving averages to generate buy and sell signals. It consists of two lines – the MACD line and the signal line. The MACD line is derived by subtracting the 26-period Exponential Moving Average (EMA) from the 12-period EMA. The signal line is a 9-period EMA of the MACD line. When the MACD line crosses above the signal line, it is considered a bullish signal, indicating a potential uptrend. Conversely, a bearish signal is triggered when the MACD line crosses below the signal line.
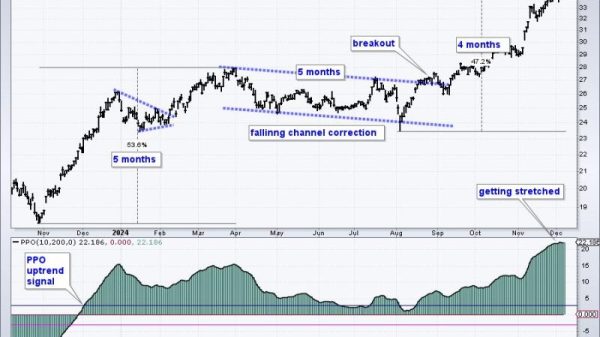
PPO is a variation of the MACD indicator that calculates the difference between two EMAs as a percentage of the longer EMA. This normalization allows traders to compare PPO values across different assets or timeframes more effectively. Like MACD, PPO generates buy and sell signals based on crossovers between the PPO line and the signal line. A crossover above the signal line is bullish, while a crossover below is bearish. Additionally, the distance between the PPO line and the signal line can provide insights into the strength of a trend.
PMO is another momentum oscillator that measures the difference between two moving averages, similar to MACD and PPO. However, PMO uses a different calculation method that incorporates price momentum and volume analysis. This unique approach makes PMO well-suited for identifying trend reversals and divergences. Traders can interpret PMO crossovers, extreme readings, and divergences to anticipate potential changes in market direction.
While MACD, PPO, and PMO share similarities in their methodology, each indicator has its own strengths and limitations. MACD is widely favored for its simplicity and reliability in trend identification. PPO offers a normalized perspective on price momentum, making it useful for comparing different assets. PMO stands out for its incorporation of volume analysis, providing a comprehensive view of market dynamics.
In conclusion, the choice between MACD, PPO, and PMO depends on the specific requirements of traders and investors. By understanding the characteristics and applications of these technical indicators, market participants can leverage them effectively to enhance their trading strategies. Whether used individually or in combination, MACD, PPO, and PMO can be valuable tools for navigating the complexities of the financial markets.