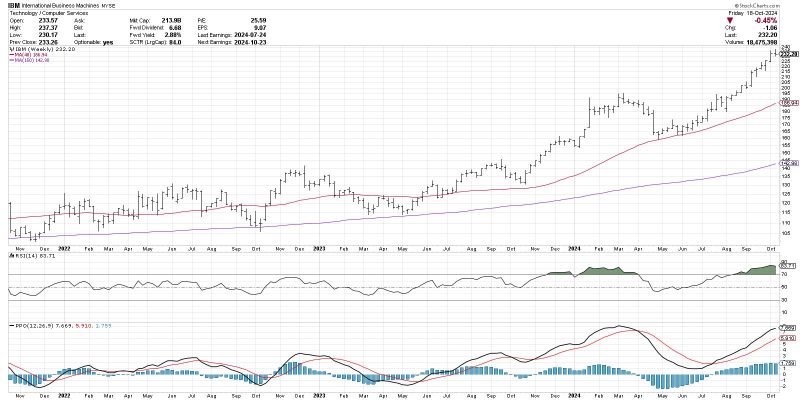
The Moving Average Convergence Divergence (MACD) histogram is a powerful technical analysis tool widely used by traders and investors to identify potential trend changes in the financial markets. With its ability to provide early signals of trends shifting direction, the MACD histogram has become a popular indicator for those aiming to anticipate market movements and make informed trading decisions.
Understanding the MACD Histogram
The MACD histogram is derived from the MACD line, which is calculated by taking the difference between two exponentially smoothed moving averages of an asset’s price. The MACD line is then plotted on a chart along with a signal line, which is a shorter moving average of the MACD line. The histogram, created by subtracting the signal line from the MACD line, visually represents the difference between the two lines and serves as an indicator of the strength and direction of a trend.
Anticipating Trend Changes
One of the primary ways in which traders use the MACD histogram is to identify potential trend changes before they occur. When the histogram crosses above the signal line and moves into positive territory, it suggests that the bullish momentum is increasing and a possible uptrend may be underway. Conversely, when the histogram crosses below the signal line and falls into negative territory, it indicates that bearish pressure is mounting, signaling a potential downtrend.
Furthermore, traders look for divergence between the price of an asset and the MACD histogram as a warning sign of an impending trend reversal. Bullish divergence occurs when the price of the asset forms lower lows while the MACD histogram forms higher lows, indicating weakening bearish momentum. On the other hand, bearish divergence occurs when the price makes higher highs while the MACD histogram forms lower highs, signaling a potential weakening of bullish momentum and a possible trend reversal.
Risk Management and Confirmation
While the MACD histogram can provide valuable insights into potential trend changes, it is essential to incorporate risk management strategies and confirm signals with other technical indicators or chart patterns before making trading decisions. False signals and whipsaws can occur, leading to losses if traders rely solely on the MACD histogram for their trading decisions.
Traders often use additional tools such as support and resistance levels, moving averages, and volume analysis to confirm signals generated by the MACD histogram. By combining multiple indicators and chart patterns, traders can increase the probability of successful trades and reduce the risk of being misled by false signals.
In conclusion, while the MACD histogram can be a valuable tool for anticipating trend changes in the financial markets, it is essential for traders to use it in conjunction with other technical analysis tools and risk management strategies. By carefully analyzing the signals provided by the MACD histogram and confirming them with other indicators, traders can enhance their trading strategies and make informed decisions in a dynamic and often unpredictable market environment.


