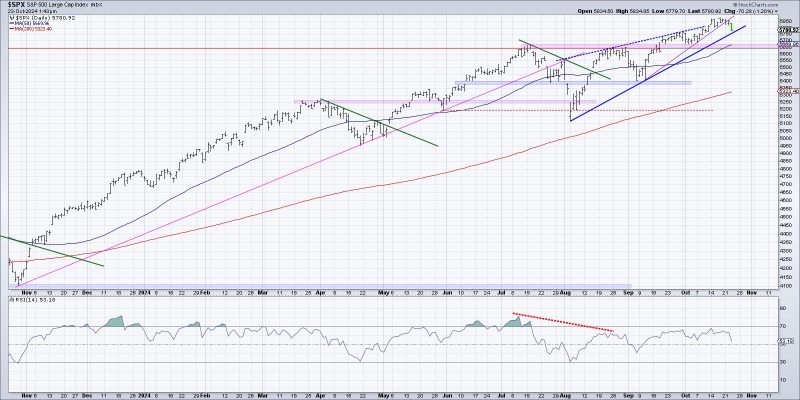
Three Ways to Visualize the Start of a Potential Distribution Phase
Point and Figure Chart Analysis
Point and figure charts are a valuable tool for traders and investors to visually identify potential distribution phases in the market. A distribution phase is characterized by an increase in selling pressure and a decrease in buying interest, indicating a shift from accumulation to distribution. By analyzing point and figure charts, traders can look for patterns such as lower tops and lower bottoms, which suggest that the stock may be entering a distribution phase. Additionally, the downtrend in the stock’s price movement, combined with increased trading volume, can further confirm the beginning of a distribution phase.
Volume Analysis
Volume analysis is another useful method for visualizing the start of a potential distribution phase in the market. During a distribution phase, there is typically a noticeable increase in trading volume as selling pressure intensifies. By examining volume bars on a chart, traders can identify spikes in volume that coincide with downward price movements, indicating that distribution may be taking place. Additionally, comparing current trading volume to historical averages can provide further insight into the strength of the distribution phase. A sudden surge in volume accompanied by a decline in price is a clear sign that distribution is underway.
Relative Strength Index (RSI) Divergence
The Relative Strength Index (RSI) is a momentum oscillator that measures the speed and change of price movements. RSI divergence can be a powerful indicator of the start of a potential distribution phase. When a stock is in distribution, there will often be a bearish RSI divergence, where the price continues to make higher highs, but the RSI fails to confirm these highs and instead forms lower highs. This divergence signals a weakening of buying momentum and a potential shift towards distribution. Traders can use RSI divergence as a visual cue to validate other technical analysis indicators and confirm the beginning of a distribution phase.
In conclusion, visualizing the start of a potential distribution phase in the market is crucial for traders and investors seeking to make informed decisions. By utilizing tools such as point and figure chart analysis, volume analysis, and RSI divergence, individuals can identify key signals that indicate a shift from accumulation to distribution. Being able to visualize these early warning signs can help traders anticipate market movements and adjust their strategies accordingly.


