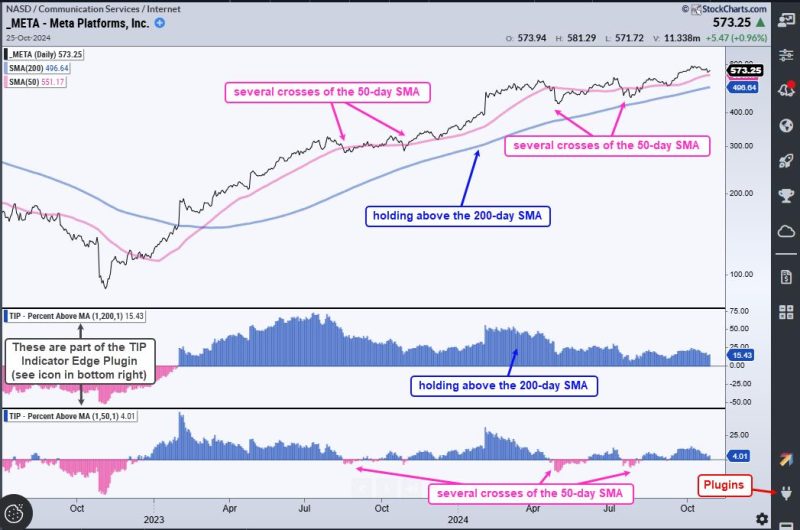
**1. Understanding Market Sentiment**
Market sentiment plays a crucial role in determining the direction of financial markets. It refers to the overall feeling or attitude of traders and investors towards a particular asset or market. The sentiment can be bullish, bearish, or neutral, and it often influences the buying and selling decisions of market participants.
One way to gauge market sentiment is to analyze sentiment indicators, which are tools that provide insights into how traders are feeling about the market. These indicators can help traders identify potential market trends and reversals, providing them with an edge in their decision-making process. Examples of sentiment indicators include the Put/Call Ratio, the VIX (Volatility Index), and the AAII Sentiment Survey.
By paying attention to these indicators and understanding their implications, traders can better position themselves to take advantage of market opportunities and manage risk effectively. For instance, a high Put/Call Ratio may signal excessive bearish sentiment in the market, potentially indicating a buying opportunity, while a low VIX level may suggest complacency among traders, which could precede a market sell-off.
Incorporating sentiment analysis into your trading strategy can help you gain a deeper understanding of market dynamics and improve your decision-making process. By combining sentiment indicators with technical and fundamental analysis, traders can develop a more comprehensive view of the market and enhance their edge in the competitive world of trading.
**2. Utilizing Price Action Patterns**
Price action refers to the movement of an asset’s price over time, and analyzing price action patterns can provide valuable insights into market dynamics. Price action patterns are formations or sequences in price movement that can indicate potential market reversals or continuations. By recognizing and interpreting these patterns, traders can make more informed trading decisions and improve their edge in the market.
Common price action patterns include chart patterns like triangles, head and shoulders, and double tops/bottoms, as well as candlestick patterns such as dojis, hammers, and engulfing patterns. These patterns form as a result of market participants’ behavior and can signal shifts in sentiment and momentum.
Traders who study price action patterns can gain a deeper understanding of market dynamics and improve their ability to time entry and exit points effectively. For example, a bullish engulfing pattern formed after a downtrend may signal a potential reversal to the upside, providing traders with an opportunity to enter a long position.
By incorporating price action analysis into their trading strategy, traders can enhance their edge by identifying high-probability trading opportunities and managing risk more effectively. Understanding how price action patterns interact with other technical indicators and market fundamentals can help traders make more informed decisions and achieve better trading results in the long run.
In conclusion, market sentiment analysis and price action patterns are two key indicators that can help traders improve their edge in the market. By understanding the underlying factors driving market sentiment and recognizing key price action patterns, traders can make more informed trading decisions and increase their chances of success. Incorporating these indicators into a comprehensive trading strategy can enhance performance and contribute to long-term profitability in the dynamic world of trading.


