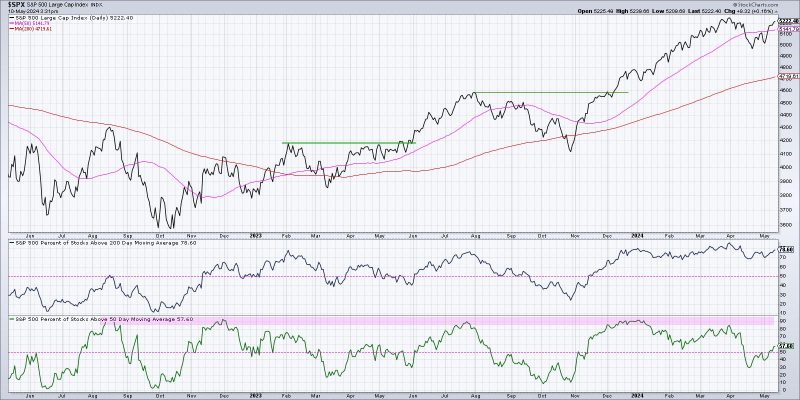
In the world of trading and investing, market trends play a crucial role in determining the direction in which assets are likely to move. Especially for those looking to capitalize on bullish trends, it’s essential to have comprehensive knowledge of the indicators that can confirm such trends. In this article, we will explore three key breadth indicators that can help traders and investors confirm a bullish market trend.
1. Advance-Decline Line (A/D Line): The Advance-Decline Line is a breadth indicator that measures the number of advancing stocks versus declining stocks in a particular market. A rising A/D Line suggests that a greater number of stocks are increasing in value compared to those that are decreasing. This indicator provides insight into the overall strength of a market trend. If the A/D Line is moving higher along with the price of an index, it confirms the bullish trend. Conversely, a divergence between the A/D Line and the price of the index could indicate weakness in the current trend.
2. New Highs-New Lows (NH-NL): The New Highs-New Lows indicator compares the number of stocks hitting new highs with the number of stocks hitting new lows over a specific period. In a bullish market trend, the number of new highs should be significantly higher than new lows, indicating broad participation among stocks in the market rally. When the NH-NL indicator is trending higher, it confirms the strength of a bullish trend. On the other hand, a divergence between the NH-NL indicator and the price trend could signal a potential reversal or weakening of the current uptrend.
3. McClellan Oscillator: The McClellan Oscillator is a breadth indicator that tracks the difference between two exponential moving averages (EMAs) of advancing and declining issues on the New York Stock Exchange. This indicator oscillates above and below a zero line, with positive readings suggesting a bullish market bias and negative readings indicating a bearish bias. During a bullish market trend, the McClellan Oscillator tends to remain in positive territory, reflecting the underlying strength in market breadth. Traders look for confirmation of a bullish trend when the oscillator moves higher, signaling increasing buying pressure and positive market sentiment.
By monitoring these breadth indicators alongside price action and other technical analysis tools, traders and investors can gain a more comprehensive understanding of market trends and make informed decisions. Understanding the broader market dynamics through the lens of these indicators can help confirm a bullish trend and guide investment strategies in a direction that aligns with the prevailing market sentiment.


