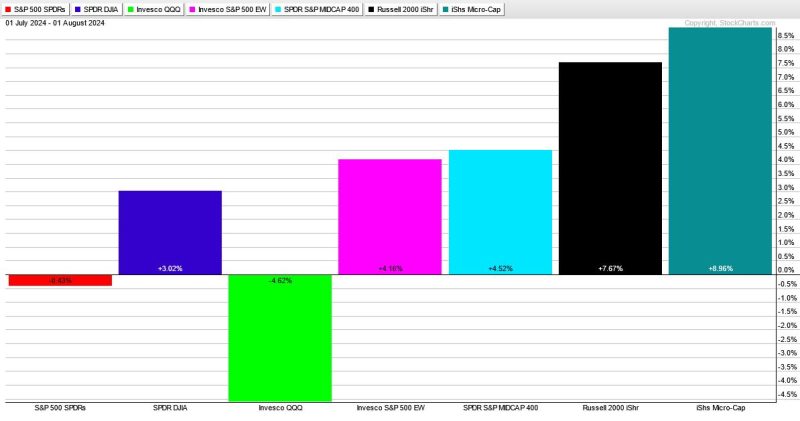
In the financial markets, there are various indicators that investors and analysts use to gauge the health and direction of the market. One such indicator gaining attention is the breadth indicator. This indicator, which takes into account the number of stocks participating in a market move, provides valuable insights into market sentiment and potential opportunities for investors.
The breadth indicator is particularly useful in identifying the overall strength or weakness of a market trend. When a large number of stocks are participating in a move, it indicates broad-based market strength. On the other hand, if only a small number of stocks are driving the market move, it suggests a lack of broad participation, which may not be sustainable in the long term.
Recently, the breadth indicator has been pointing towards more downside in the market. This could be a cause for concern for investors, as it signifies a lack of broad-based participation in the current market rally. When a market move is driven by only a few stocks, it is often seen as a fragile trend that may not be supported by the wider market.
However, it’s essential for investors to view this potential downside as an opportunity rather than a setback. A market pullback can present buying opportunities for astute investors looking to enter the market at more favorable levels. By using the breadth indicator as a guide, investors can better time their entries and exits, maximizing their potential returns.
In times of market uncertainty, it’s crucial for investors to stay informed and keep a close eye on indicators like the breadth indicator. By understanding the dynamics of market breadth and its implications, investors can navigate volatile market conditions more effectively and position themselves for long-term success. Remember, while the breadth indicator may point to more downside in the short term, it also presents an opportunity for investors to capitalize on potential market movements and optimize their investment strategies.


